
Using Glacial Geology to Study the Ice-thinning History Since the Last Glacial Maximum Alongside Hatherton Glacier, Antarctica
Using Glacial Geology to Study the Ice-thinning History Since the Last Glacial Maximum Alongside Hatherton Glacier, Antarctica
Hatherton Glacier, Antarctica 2013
Using Glacial Geology to Study the Ice-thinning History Since the Last Glacial Maximum Alongside Hatherton Glacier, Antarctica.
Field Team Members: Courtney King1,2, Dr. Brenda Hall1,2, Trevor Hillebrand3, and Dr. John Stone3
1. Climate Change Institute, University of Maine
2. Department of Earth and Climate Sciences, University of Maine
3. Earth and Space Sciences Department, University of Washington
Hatherton Glacier, Antarctica
December 3 – 28, 2013
Funding Support: National Science Foundation
Introduction
The future of the Antarctic Ice Sheet (AIS) is of great concern because if it completely melted, sea-level would rise greater than 60 m. In particular, the marine-based West Antarctic Ice Sheet is thought to be inherently unstable and susceptible to rapid collapse. In order to better understand the stability of the AIS and its potential for future collapse, we need to gain insight into its past. During the last glacial maximum, the most recent time at which the AIS was at its greatest extent (approximately 20,000 years ago), ice grounded in the Ross embayment. This grounded ice buttressed inflowing outlet glaciers from the East Antarctic Ice Sheet, causing them to thicken and flow into currently ice-free valleys of the Transantarctic Mountains. Obtaining a chronology using the glacial geology deposited by the formerly thicker ice will provide insight into not only the timing of the last glacial maximum, but an ice-thinning history of the AIS. Along with our collaborators from the University of Washington, Dr. John Stone and Trevor Hillebrand, my advisor, Dr. Brenda Hall, and I spent four weeks collecting rock samples for surface exposure-age dating and algae samples for radiocarbon dating that will produce precise ice-thinning chronologies from alongside Hatherton Glacier, Antarctica.
Field Work
The four of us first traveled to McMurdo Station, the US base in Antarctica, where we spent a few days collecting camping gear, food, and sampling equipment before flying out to our first field area in the Transantarctic Mountains. Because this was our first year on the ice, Trevor and I were required to attend Happy Camper snow school where an instructor taught us how to survive the continent’s harsh elements (Figure 2). Upon completion of all required training and collection of necessary gear, we flew to our field area on a Bell 212 Helicopter.
This year, we visited two sites alongside Hatherton Glacier, the first of which was the Lake Wellman area (Figure 3). While in the field we collected fossil algae samples from relict lake deposits along transects beginning at the present lake margin (Figure 4). These samples can tell us two things about the collection site: 1) the glacier ice was thick enough to dam the ice-marginal pond in which the algae grew and 2) the glacier ice existed near that location at the time the algae was alive. Based on these two assumptions, the ages of the fossil algae provide a time at which the ice was thicker than present, and a series of samples transecting the valley will give us an idea of how quickly the ice thinned (Figure 5).
After completing our work at Lake Wellman, we traveled to an ice-free region alongside upper Hatherton Glacier – Dubris Valley, Danum Platform, and Bibra Valley. A secondary objective of our research is to map the glacial deposits left behind by formerly thicker glacial ice. The valleys alongside upper Hatherton Glacier had some of the most spectacular drift deposits (Figure 6)! Additionally, our collaborators from the University of Washington, Dr. John Stone and Trevor Hillebrand, collected rock samples (predominately sandstone) for cosmogenic surface exposure-age dating using 10-Beryillium. This is a popular method used to date glacial erratics because it involves counting the number of atoms of 10Be, an isotope of the element Beryllium, which is produced when cosmogenic rays react with quartz (SiO2) molecules in the rock. As erratics are transported in the ice, erosion removes the outer layer of the rocks, essentially eliminating the accumulated 10Be and resetting the clock that measures how long it’s been exposed to the atmosphere. The clock begins once the erratics are deposited by the glacial ice because they begin accumulating the 10Be isotope.
Future Work
Now that all samples have been shipped back to the United States, fossil algae will be sent to Woods Hole Oceanographic Institute for AMS radiocarbon dating and student Trevor Hillebrand will use a series of strong reagents to chemically isolate the 10Be (in the form of BeO) at the Cosmogenic Nuclide Laboratory at the University of Washington. The actual 10Be isotopic measurements will be performed using a Mass Spectrometer at the Lawrence-Livermore National Laboratory. These data will produce precise chronologies representing the ice-thinning history along Hatherton Glacier. Additionally, I am working on digitizing glacial geomorphic maps of the two field sites using ArcGIS software.
-
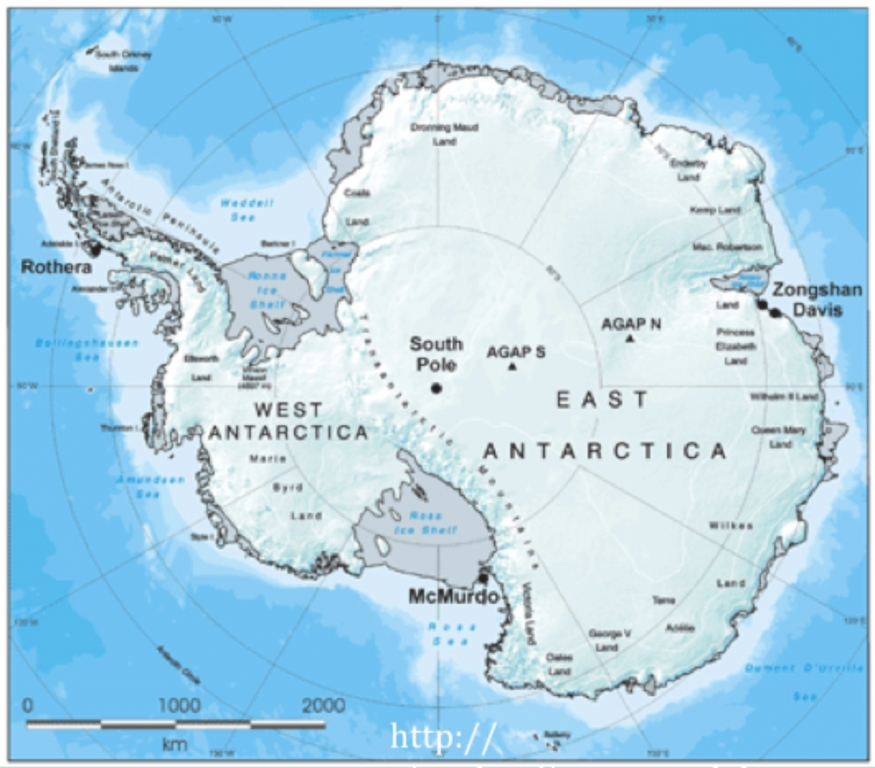
- Figure 1: An overview of the continent highlights the drastic size difference between the East and West Antarctic Ice Sheets; the East AIS is primarily land-based and the West AIS is marine-based. The Transantarctic Mountains divide the two ice sheets – outlet glaciers flow from East Antarctic, through the Transantarctic Mountains and into the Ross embayment, in contrast ice streams flow from West Antarctica into the embayment.
-
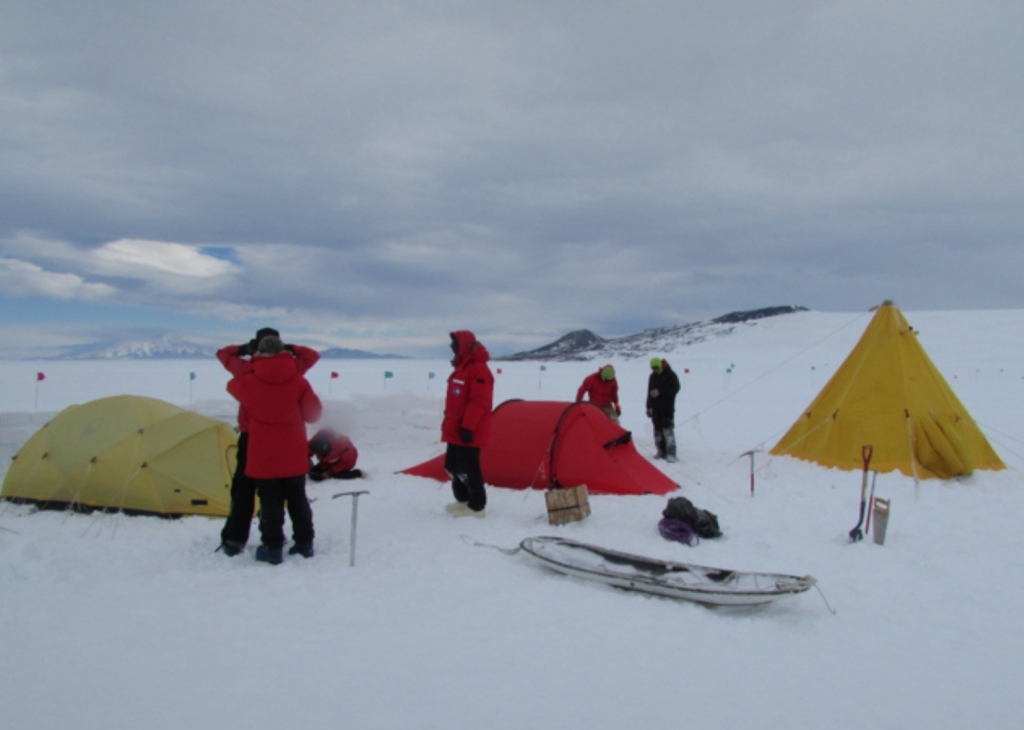
- Figure 2: Happy Camper students setting up mountaineering tents and a Scott tent for an overnight on the McMurdo Ice Shelf. In the background, there is the snow wall the students built to shield the tents from strong winds.
-
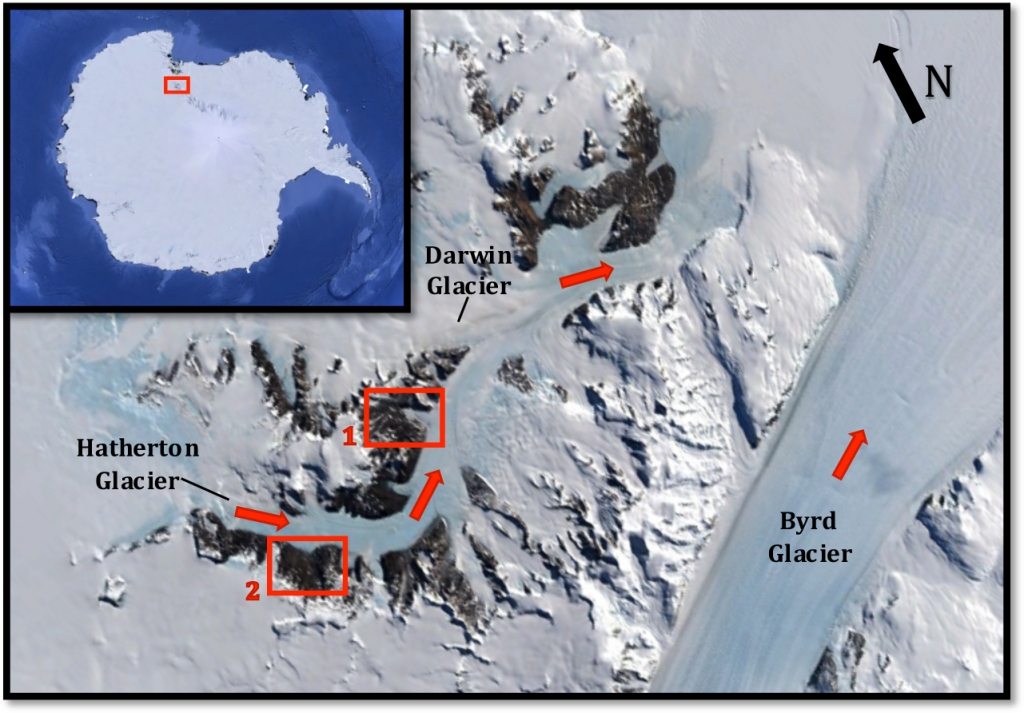
- Figure 3: Hatherton Glacier is a tributary of Darwin Glacier, located just north of Byrd Glacier, the largest outlet glacier that drains into the Ross embayment. Lake Wellman is the first site we visited (1) and the second region contains Dubris Valley, Danum Platform, and Bibra Valley (2). In general, East Antarctica is located to the left of this image, and the Ross Ice Shelf is located to the right. Red arrows indicate the glaciers’ flow direction.
-
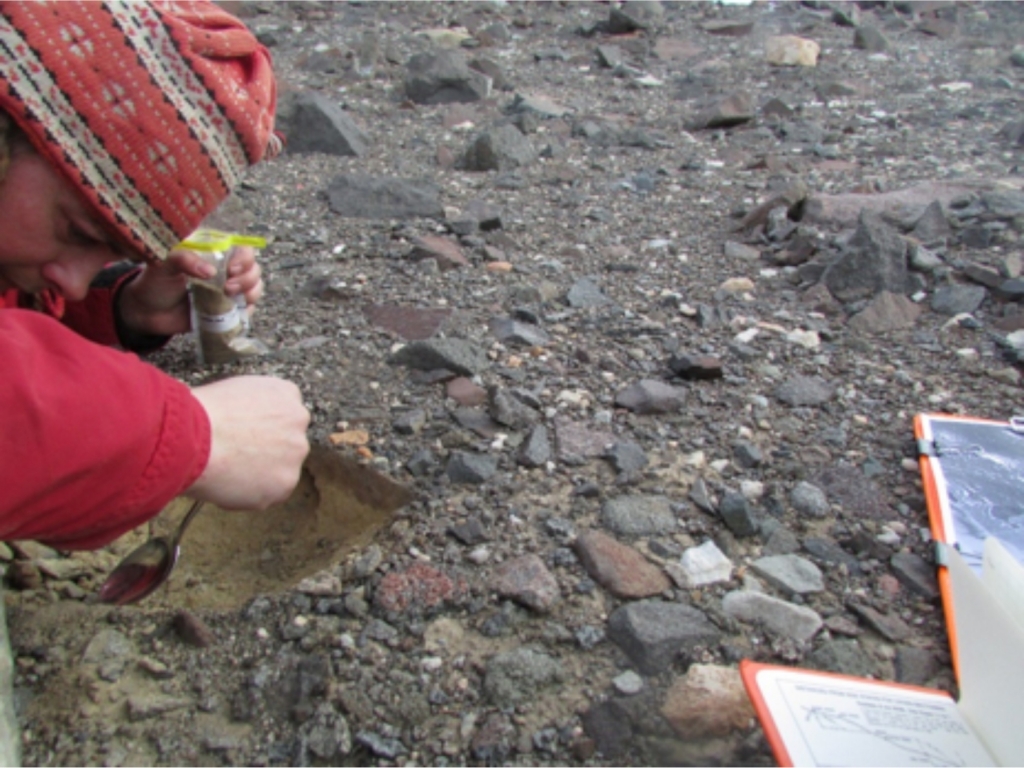
- Figure 4: Dr. Hall collecting a fossil algae sample from a relict lake deposit.
-
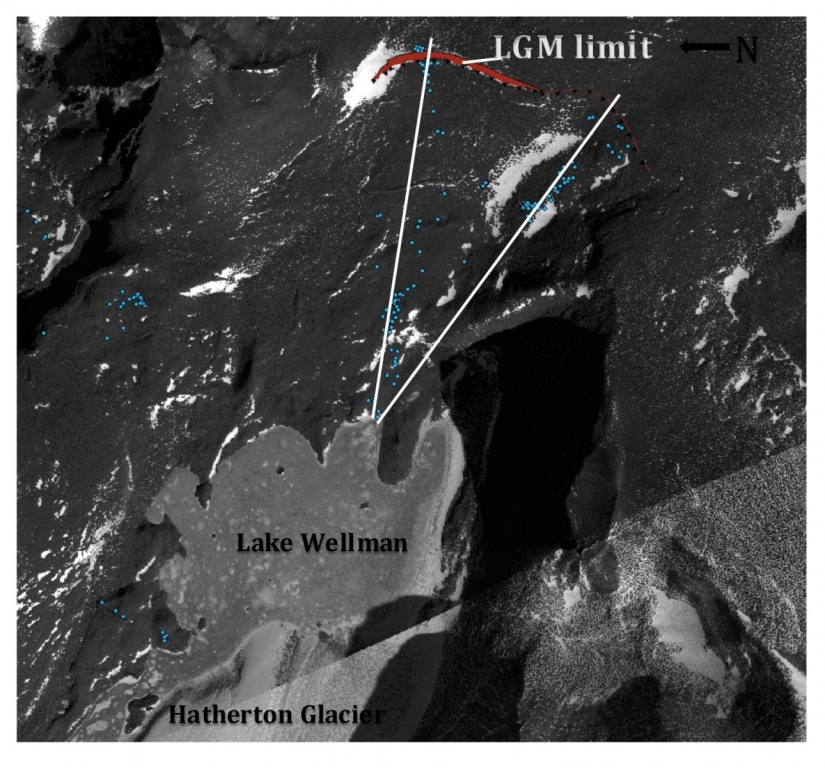
- Figure 5: This is a satellite image of the Lake Wellman area, and the blue dots represent the fossil algae samples collected during the 2013 field season. At the last glacial maximum (LGM) ice extended to limit labeled above. The ages of the fossil algae will allow us to understand the timing of ice-thinning down to the present glacial position. Bockheim et al. (1989), first mapped the region and assigned relative ages to the drift deposits using limited algae samples and drift correlations from other sites in the Transantarctic Mountains.
-
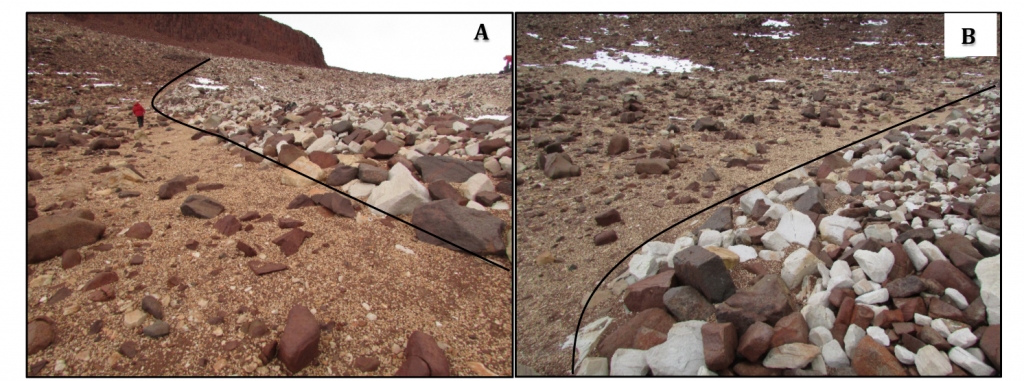
- Figure 6: Photographs of the Marine Isotope Stage 6 glaciation limit (the penultimate glacial period). Outlined in black is the edge of the drift deposit in Dubris Valley. In A) the direction of ice flow is from the upper right and in B) the direction of ice flow is from the bottom right. The younger drift contains fresher (whiter) and larger boulders of sandstone relative to the older drift. Over time, the sandstone weathers faster than the dolerite (red boulders) therefore, older drift deposits, as the one pictured here, is absent of large, fresh sandstone.
References Cited
Bockheim, J. G., Wilson, S. C., Denton, G. H., Andersen, B. G. & Stuiver, M. Late Quaternary ice-surface fluctuations of Hatherton Glacier, Transantarctic Mountains. Quat. Res. 31, 229–254 (1989).