Characterizing the Near-surface Properties of and Improving Snow Water Equivalent Estimates on the Bering Glacier System, Alaska and Canada
Expedition Field Team Member: Mikaila A. Mannello, Climate Change Institute, University of Maine, Orono, ME
Expedition Funding: Dan and Betty Churchill Exploration Fund, the Mount Logan Ice Core Project, University of Alberta Canadian Ice Core Lab, and the Maine Space Grant Consortium.
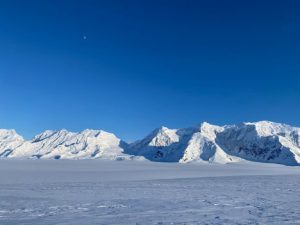
Field Expedition Location: Quintino Sella Glacier, Yukon Territory, Canada
Expedition Dates: May 6-18, 2022
Funding Support: Dan and Betty Churchill Exploration Fund, the Mount Logan Ice Core Project, University of Alberta Canadian Ice Core Lab, and the Maine Space Grant Consortium
Methods:
Addressing these objectives require collecting longitudinal ground-penetrating radar (GPR) transects to characterize the snow and firn stratigraphy, recording snow pit depth-density profiles for SWE calculations, and conducting ground-truth measurements to determine radiowave velocity in the snow.
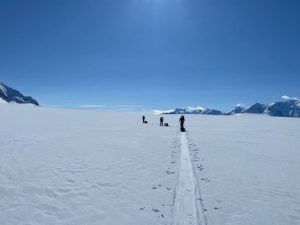
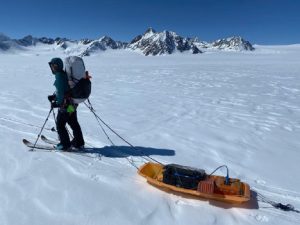
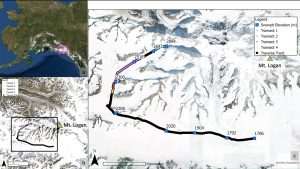
GPR surveys were collected between May 6-19, 2022 using a 400 MHz antenna and GSSI SIR4000. In this environment, the system penetrates approximately 10-40 m deep, allowing for the detection of the depth of the annual snow accumulation as well as the depth to the transition to glacier ice. The system was ski towed at a rate of 1 km hr-1 and collected data with the following parameters: 500 ns two-way travel time (TWTT) and 2048 samples/scan. Data collection began at 2894 m a.s.l. at Mt. Logan basecamp and continued down the Quintino Sella Glacier onto the Seward Glacier to 1706 m a.s.l.
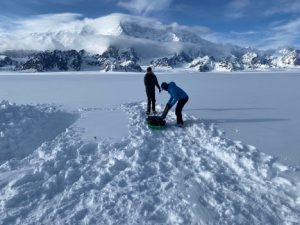
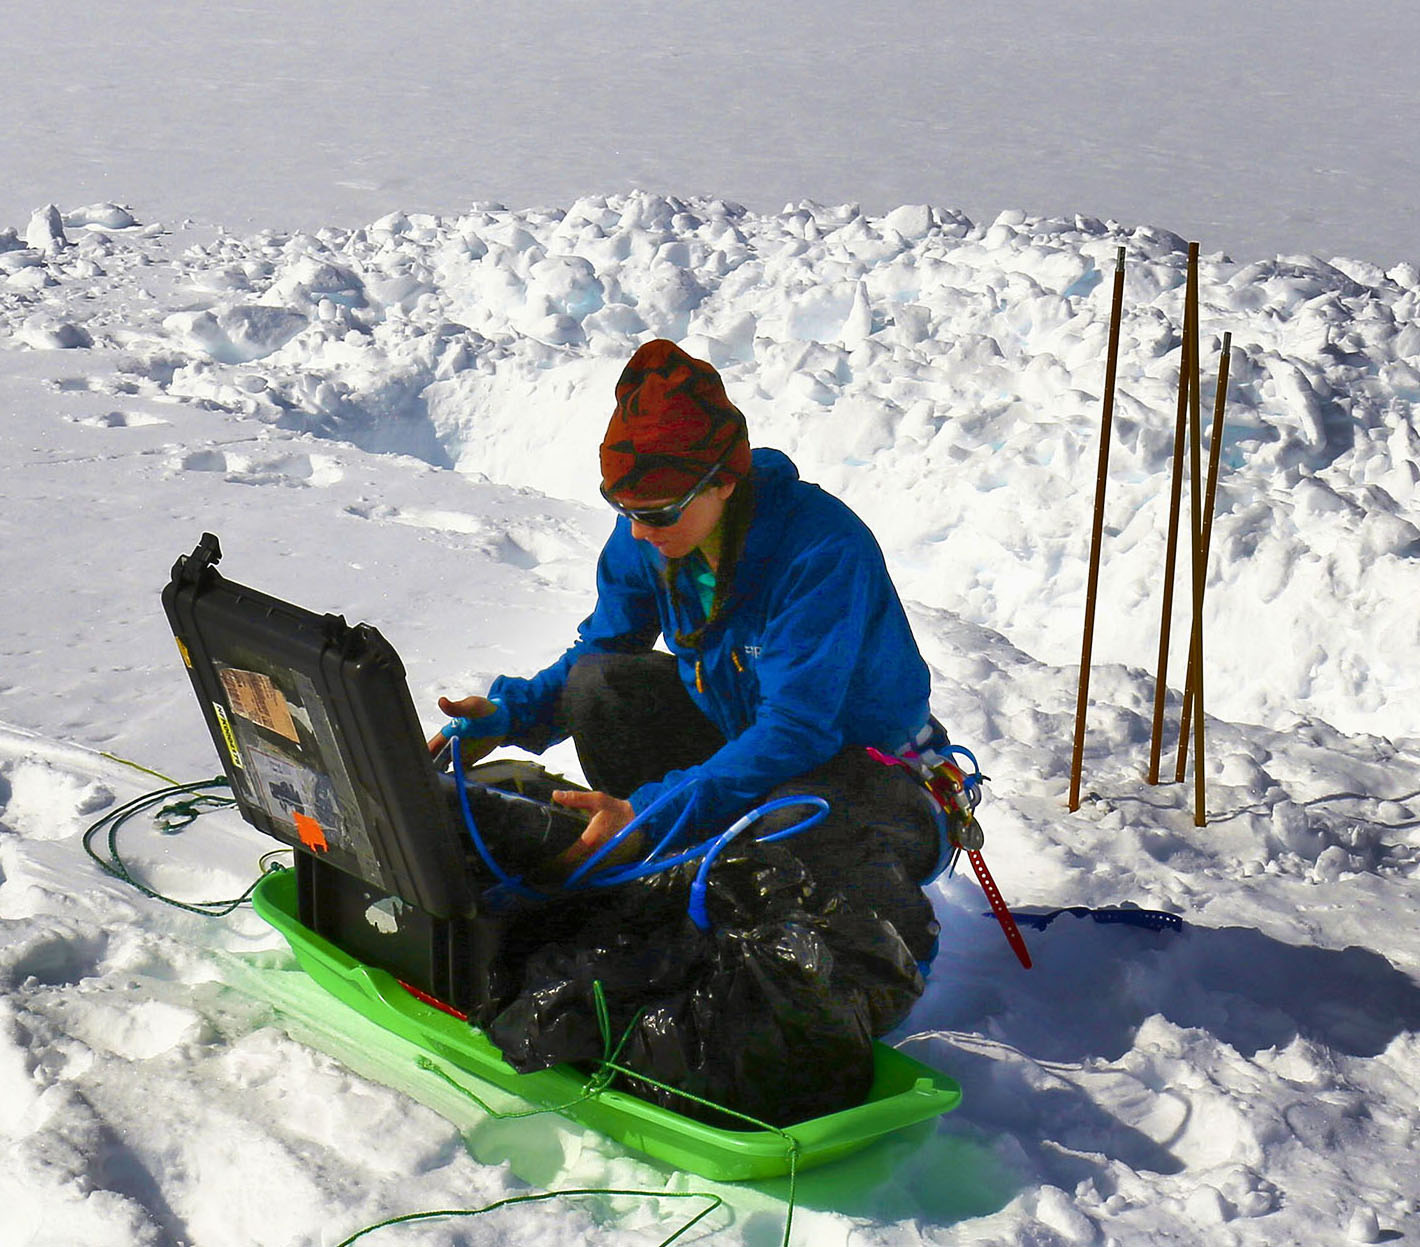
At nine snow sampling sites down-glacier, snow pits were dug to the first ice layer, 1.7-2.5 m deep. This was a constraint for snow sampling for the primary objective of the expedition. Density measurements were collected at 10 cm vertical resolution. Due to issues with getting proper masses, we had to use a more qualitative method, snow hardness evaluations, for the majority of the pits.
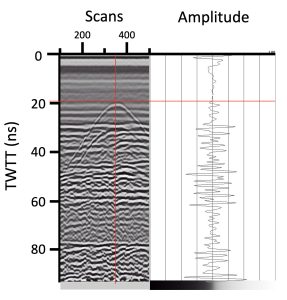
At each site, we conducted ground-truthing efforts to determine the of the snow and radiowave velocity to determine depths on the longitudinal GPR. Ground-truthing consisted of horizontally inserting a survey-grade snow probe at the bottom of each snow pit, so that it extended into the sampling wall 2.5 m. The depth of the probe, z was recorded and the GPR was towed perpendicular to the probe, parallel to the sampling wall, at 2.5 m distance from the pit sampling wall along approximately 8-10 m track. Two ground-truth surveys were conducted at all pits, one at 500 ns and a second at 100 ns, except for the first where the two surveys were both at 500 ns. Post-processing, the TWTT to the vertex of the hyperbola was manually identified in the radargrams (Figure 2). This hyperbola indicates the metal probe at the measured depth in the snowpack. With the measured depth of the probe and the TWTT to the known position of the probe, of the snowpack was calculated (Eq. 1).
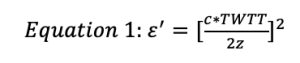 , where c is the speed of light (0.3 m/ns).
Results:
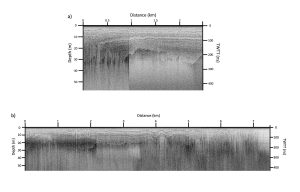
Longitudinal survey 1 (2894 to 2693 m a.s.l.) began just down glacier from an icefall and well above the equilibrium line altitude (ELA). The firn-ice transition reaches 20-30 m depth (~150-250 ns) (Figure 3a). Here, the shallowest 30 m is characterized by distinct horizontal layering. The most complex stratigraphy is observed at the highest elevation, just down-glacier from the icefall, and between 1.0-1.5 km where there is a bifurcation in the firn layers near 20 m depth.
Longitudinal survey 2 (2600-2300 m a.s.l.) reveals firn-ice transition horizons as deep as 30 m trending towards the surface (<10 m) going down-glacier (Figure 3b). This is the longest and most continuous profile that was collected. Between 0-2.0 km, layered stratigraphy can be resolved down to ~10 m depth. Between 2.0-3.8 km, this depth increases to approximately 20 m depth before thinning from 3.8 km towards the end of the profile.
The relative permittivity of the upper snowpack varied between 1.216-1.522, corresponding to velocities, v, of 0.272 m/ns and 0.243 m/ns, respectively. The average calculated was 1.37 (v = 0.256 m/ns). The relative permittivity during the 8-hr time series ranged between 1.11-1.46 and yielded an average of 1.38 and did not exhibit much variability.
Significance and Interpretation:
The variable layers near the icefall (approx. 2900 m) make sense due to the extensional and compressional pressures as it flows down-glacier. The lowest discernable horizon in Transect 2 dipping towards surface may be interpreted as thinning firn layers. The Quintino Sella is an up-glacier tributary to the Bering Glacier System that exhibits surge dynamics6. This thinning of the firn in this region of the Quintino Sella could be indicative of dynamic thinning due to previous surges of the down-glacier system or a rise in the ELA towards higher elevations of the glacier.
Our relative permittivity values for the elevational transect range between 1.216 to 1.522 and show little to no elevational trend. These observations are in agreement with other studies focused on a dry snowpack7, which is expected in this region during May. In our temporal study, despite changing surface snow and air temperatures, the relative permittivity of the upper 2.5 m of the snowpack did not vary outside of the range of uncertainty. These results are consistent with the snowpack existing below freezing, as opposed to being a temperate snowpack during data collection. These values for relative permittivity are consistent with what is expected from a polar snowpack where relative permittivity does not change on an hourly time-scale. We excluded ground truth measurements at the 2208 m a.s.l. site because the calculated <1, meaning the radiowave would have to have traveled faster than the speed of light. We hypothesize that the calculated values of <1 at this site are due to the probe being inserted on a plane not parallel with the surface or not perpendicular with the radar track. Either of these possibilities could affect the calculated relative permittivity.
SWE estimations depend on the determination of the previous summer ablation horizon. Continued work includes identifying the annual accumulation horizon and calculating SWE values at the snowpits and along transects where quantifiable density measurements were collected.
Project Success:
Due to technical difficulties with our power source, we only had enough battery to finish conducting the ground-truthing efforts at all of the pits and ceased collecting longitudinal data. While we were not able to accomplish all of the research objectives we set out on, it was successful in collecting some longitudinal profiles and in conducting an elevational study of the relative permittivity of the snow.
Acknowledgements:
This research was generously supported by the Dan and Betty Churchill Exploration Fund, the Mount Logan Ice Core Project, University of Alberta Canadian Ice Core Lab, and the Maine Space Grant Consortium. Data collection was carried out and facilitated by our field team, including Kira Holland, Jonathan Maurer, Darren Farley, and Pierre Valero.
Publications and Follow-up Proposals Resulted from this Award:
None at this time.
References:
- Sharp M (1951) Thermal Regimen of Upper Seward Glacier, Yukon Territory, Canada. Glaciol. 1(9), 476-487 (doi:10.3189/S0022143000026460)
- Jansson P, Hock R, and Schneider, T (2003) The Concept of Glacier Storage: A Review. Hydrol., 282(1–4), 116–29 (doi:10.1016/S0022-1694(03)00258-0)
- Harper J, Humphrey N, Pfeffer W, Brown J, Fettweis X (2012) Greenland ice-sheet contribution to sea-level rise buffered by meltwater storage in firn. Nature, 491, 240–243 (doi:10.1038/nature11566)
- Miller O and 7 others (2018) Direct Evidence of Meltwater Flow Within a Firn Aquifer in Southeast Greenland. Res. Lett., 45(1), 207-215 (doi:10.1002/2017gl075707)
- Beniston M (2003) Climatic Change in Mountain Regions: A Review of Possible Impacts. Climatic Change, 59, 5–31 (doi:10.1023/A:1024458411589)
- Muskett R. et al. (2009). Airborne and spaceborne DEM- and laser altimetry-derived surface elevation and volume changes of the Bering Glacier system, Alaska, USA, and Yukon, Canada, 1972–2006. Glaciology, 55(190), 316-326 (doi:10.3189/002214309788608750)
- Matzler (1996) Microwave permittivity of dry snow. IEEE Trans Geosci Remote Sens, 34(2), 573-581 (doi: 10.1109/36.485133)
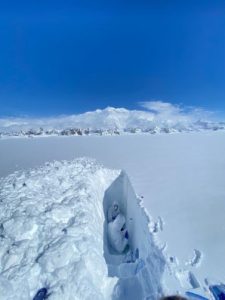
Field Photos: