Field Team Members: Dan Sandweiss 1,2, Cecilia Mauricio 3, Paul Roscoe 1,2, Alice Kelley 1,2,4, Emily Blackwood1,2, Gloria Lopez5, and James Munch.
1Climate Change Institute, 2Anthropology Department, 3Pontificia Universidad Católica del Perú, 4School of Earth & Climate Sciences, 5CENIEH
Expedition Funding Acknowledgement: Churchill Expedition Fund and University of Maine College of Liberal Arts and Sciences Dean’s Office
Expedition Report: For several weeks in the month of August, 2018, as part of an interdisciplinary team of researchers (Figure 1), I traveled to the archaeological site known as the Ostra Collecting Site in Peru with the intent to gather the necessary data to create a reconstructed virtual representation of the site when it was in use. Understanding the context of a site (who was there, what they were doing, when they were there, where the site boundaries are, why they were there, and how the site was constructed and used) is of vital importance to the overall interpretation of a site and its occupants. In order to gain these insights, manual excavation is the traditional mechanism, however, supplementing excavation with new technologies has the ability to enhance archaeological interpretations. The process of excavation translates 3D data into 2D data in the form of level sheets, photographs, and fieldnotes. These data are difficult to visualize partly due to the massive amount of data collected and partly due to humans’ cognitive limitations with spatial transformation. Archaeologists take extensive notes in an attempt to combat this issue of data visualization by measuring depths, plotting artifacts, recording stratigraphy, and noting the color and texture of every object, but this remains as 2D datasets spatially confined within each excavated unit. To address this, I developed a methodology to take these 2D datasets and transform them into a virtually reconstructed, 3D immersive environment that is representative of the Ostra Collecting Site.
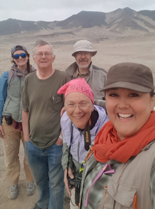
Figure 1: Five of the six members of our interdisciplinary research team in the field. Left to right: myself, Prof. Paul “Jim” Roscoe, Prof. Dan Sandweiss, and Prof. Alice Kelley (all from UMaine), Dr. Gloria López from CENIEH in Burgos, Spain, not pictured is lawyer Jim Munch of Bangor. Photo credit: GL
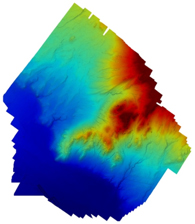
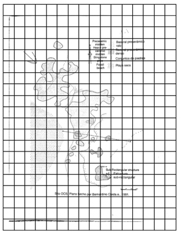
The first step of this research entailed establishing a protocol and methodology incorporating equipment that was available to use in the field in Peru. It was determined that a drone would be used to capture aerial images of the site and to create a 3D model that would serve as the base layer for the virtual reconstruction. Drone images can also be used to create heightmaps and identify features on the landscape, such as the ancient shoreline present on the site (Figure 2). In order to accurately texture the surface of the drone’s base layer, I created a 20×20 meter grid over the site (Figure 3) where six ground level photographs (using a camera and an iPhone 6) were taken to form a 360-degree view from each grid point. An iPhone 6 was used in addition to a camera because I wanted to determine if it was feasible to create a virtual reconstruction using minimal technology that is generally available to everyone for everyday use. These photos provide color, surface textures, and viewpoints to reference when creating the surface layer that will overlay the base layer. While these photos were being taken, an application called Geotag Photos Pro 2 was recording each grid points’ location so that the coordinates could later be used to georeference the photos to provide as much accuracy as possible in the virtual reconstruction.
“My advisor (Dan Sandweiss) and myself setting up a 1×1 meter excavation unit inside a stone structure at the Ostra Collecting Site.Figure 2: An example of an elevation map created from the drone data, the dark blue indicates where the ancient shoreline is located.Figure 3: The above figure was adapted from a map commissioned by Dan Sandweiss in 1991, overlaid with a 20×20 meter grid.
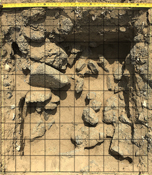
Step two consisted of excavation and recording data through the traditional methods used by archaeologists. A 1×1 meter unit was excavated (Figure 4) in the northeast corner of a stone structure recording data on level sheets, photographs, and fieldnotes. Excavation proved to be difficult at times as the structure is situated on the top of a mound and susceptible to high winds. It is also located in the desert making it challenging to prevent the walls of the unit from collapsing in and to keep surface sand from blowing into the excavation unit. However, clear stratigraphic levels remained visible and the excavation was completed within the allotted time. These datasets will be used to infer and reconstruct what the structure looked like during occupation.
Figure 4: An example of a completed 1×1 meter excavation level. Photo credit: EB
While these two steps were being completed, several other members of the research team were working to collect data using a technique called Optically Stimulated Luminescence (OSL) in order to determine if the lines of slingstone piles present on the site date to the same age period of ~6,000 years ago to which the site has previously been radiocarbon dated. This is of particular interest for several reasons, if they prove to be congruent dates then first, the piles must be included in the virtual reconstruction, and second, we will have evidence of the earliest occurrence of warfare in South America because the slingstone piles are defensive artifacts. If the dates are not congruent, the piles will still be included in the reconstruction, but will not materialize on the surface until the appropriate time. If they are congruent, I can use the VR to look at approaches to the site considering likely range of slings, thus assessing the defensive intelligence of the inhabitants.
Step three involves data interpretation, analysis and creation of the virtual environment. This work is currently underway at the VEMI (Virtual Environment and Multimodal Interaction) Lab on the UMaine campus as part of my doctoral research. The goal of my research is to establish a platform to showcase archaeological data through a 3D perspective, allowing archaeologists and other researchers the opportunity to immerse themselves in the entirety of the site versus individual 2D level sheets. This type of platform also provides opportunities to foster relationships between scientists and the public, incorporates an interdisciplinary perspective, and can be replicated and implemented into future archaeological fieldwork.