
Southwest Greenland Water Quality Expedition
Expedition Location: Southwest Greenland
Expedition Dates: 06/08/2024 – 06/23/2024
Field Team Members: Cory Limberger, PhD Student, Climate Change Institute; Rachel Fischer, Maine Law School Graduate Student and Alex Drew, Maine Law School Graduate Student
Funding Support: Mrs. Elisabeth Crowley
I want to begin this report with gratitude and thanks to Mrs. Elisabeth Crowley for making this work possible. Having the opportunity to learn to collect data in the field and plan and lead a portion of this year’s field season has been an experience that I will learn from and carry with me as I move through my Ph.D., post-graduate work, and my life.
Introduction
The primary objective of the fieldwork conducted in the Kujalleq municipality was to collect freshwater from melting glaciers and snow and to sample freshwater lakes. This water was collected and brought back to the lab at the Climate Change Institute to be analyzed for stable isotopes, ions, trace and heavy metals, and PFAS. This was done by hiking to sampling regions on foot and traveling between sampling locations by boat. In addition to water collection, there were opportunities for cultural exchange, learning, and fun.
The water collection and subsequent analysis aim to provide a comprehensive and spatially distributed water quality data set. This spatial distribution is part of a broader effort to provide baseline data set for water quality measurements throughout the west coast of Greenland. Additionally, sampling in this region included several sites visited by CCI researchers in the previous two years, which this year added to yielding a yearly temporal sampling distribution.
Expedition Team
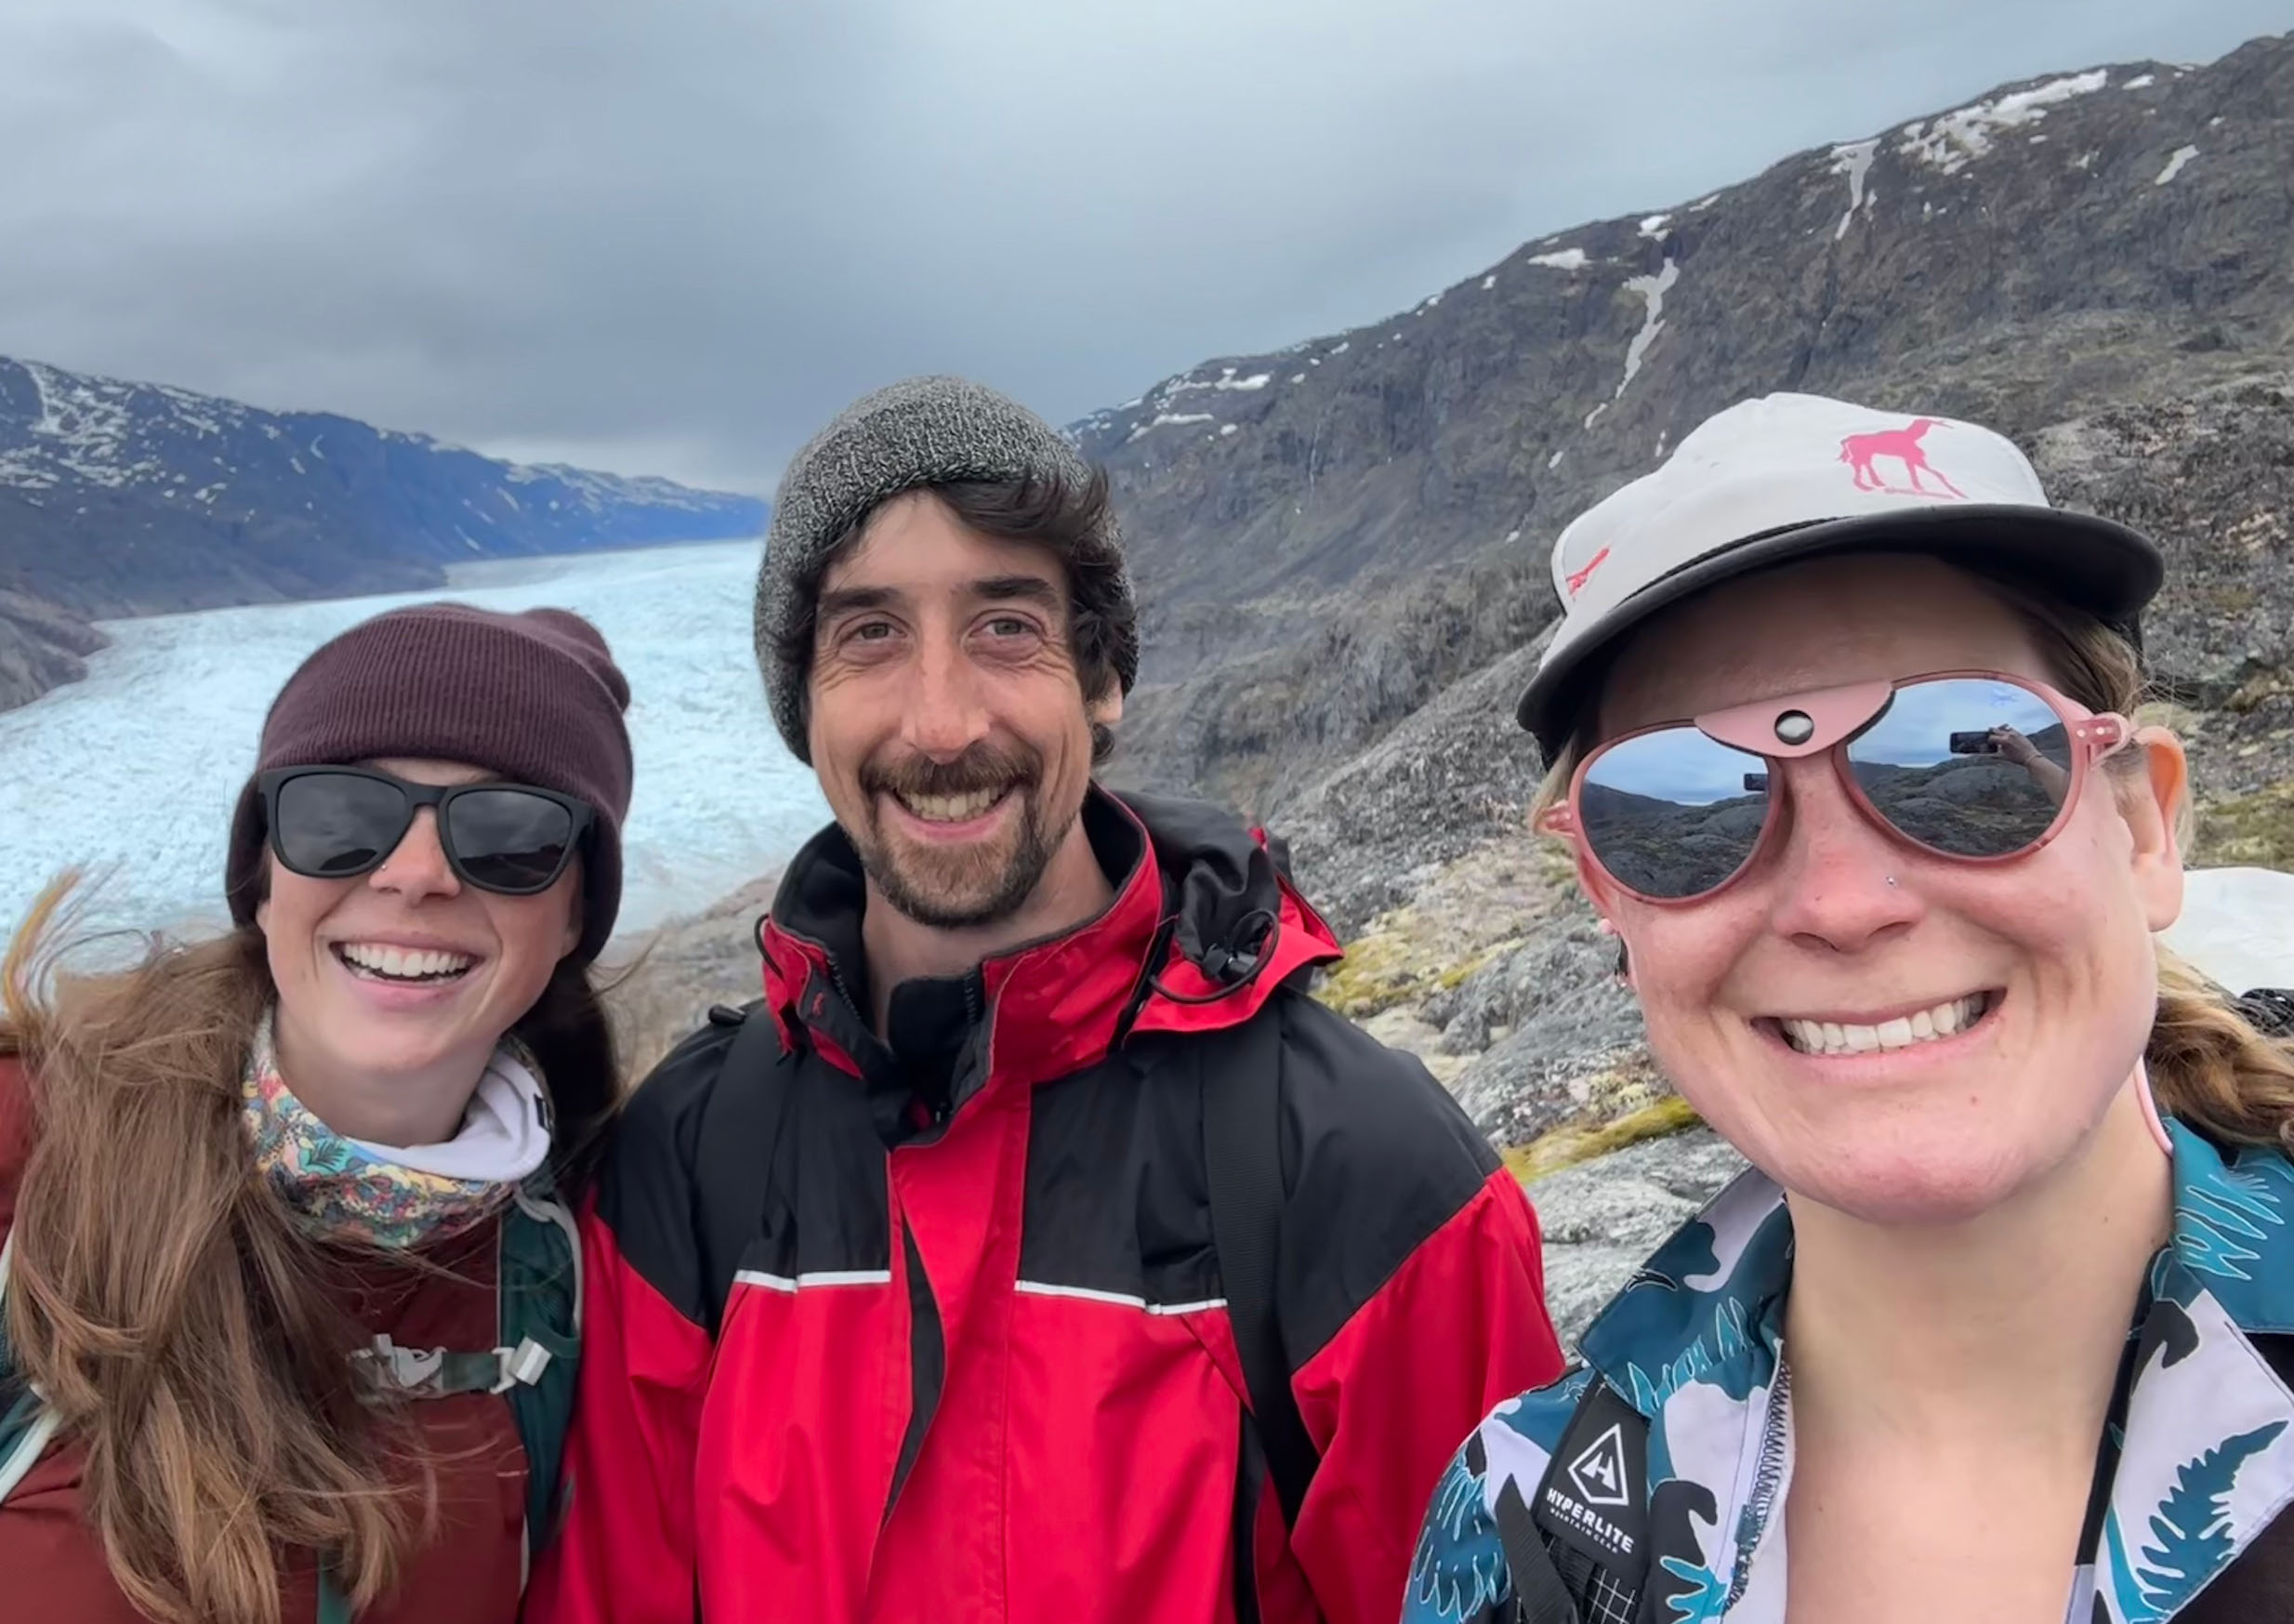
The team for the expedition to South Greenland included Cory Limberger, Rachel Fischer, and Alex Drew. Each has an abiding interest in the future of law and policy in the Arctic and Greenland. Rachel will be proceeding with her summer doing work with Friends of Casco Bay, where she will continue to combine science and law as she works on regulations related to monitoring the bay while also working with scientists collecting water samples throughout Casco Bay. Alex begins work with the Governor’s Energy Office, assisting their offshore wind initiative to build an offshore wind science and policy road map for Maine.
Methodology
A. Description of Sampling Locations
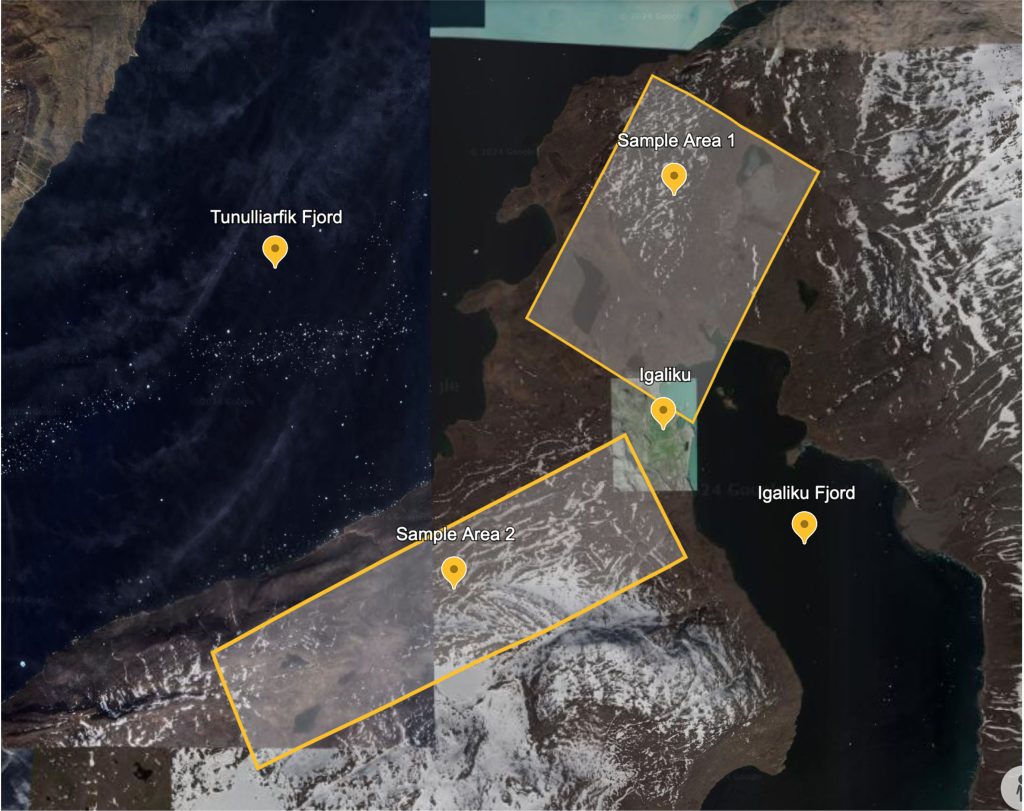
This expedition took place over two weeks in Southern Greenland in the Narsarsuaq region in four different settlements along the Tunulliarfik and Igaliku Fjords.
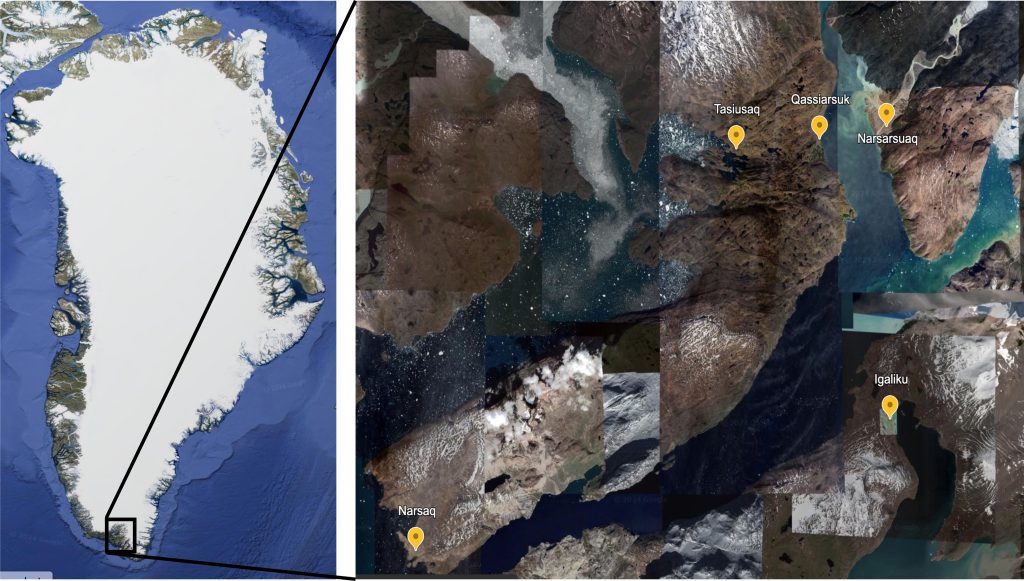
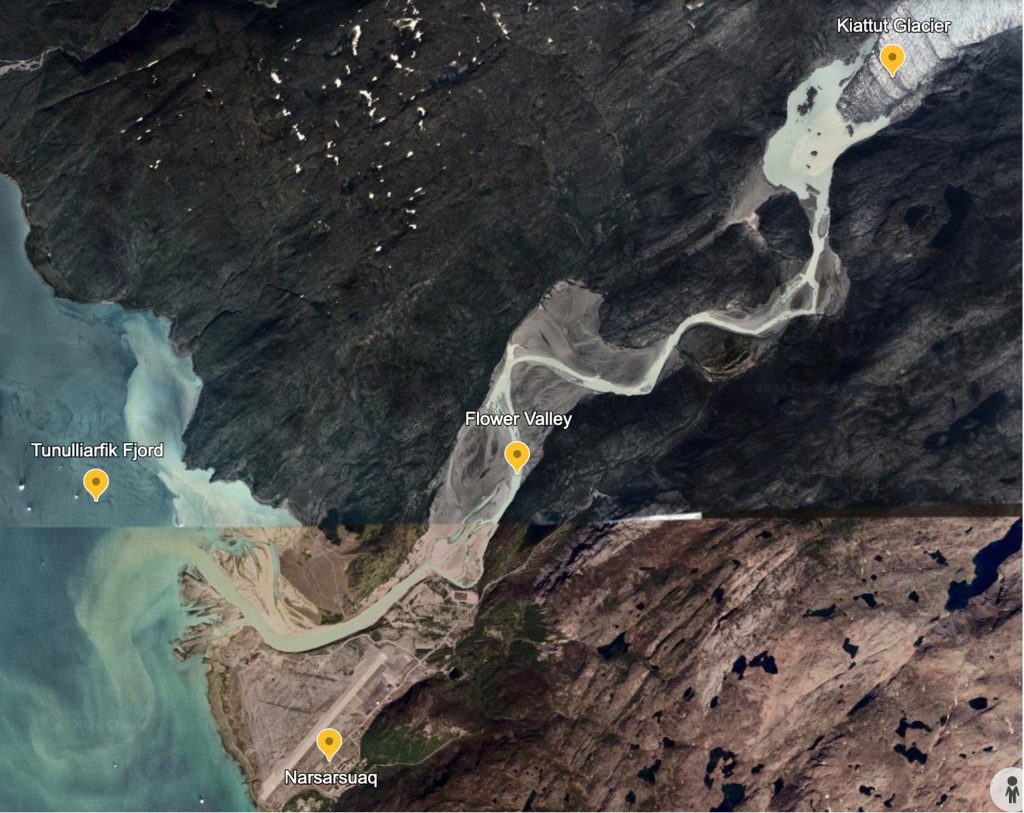
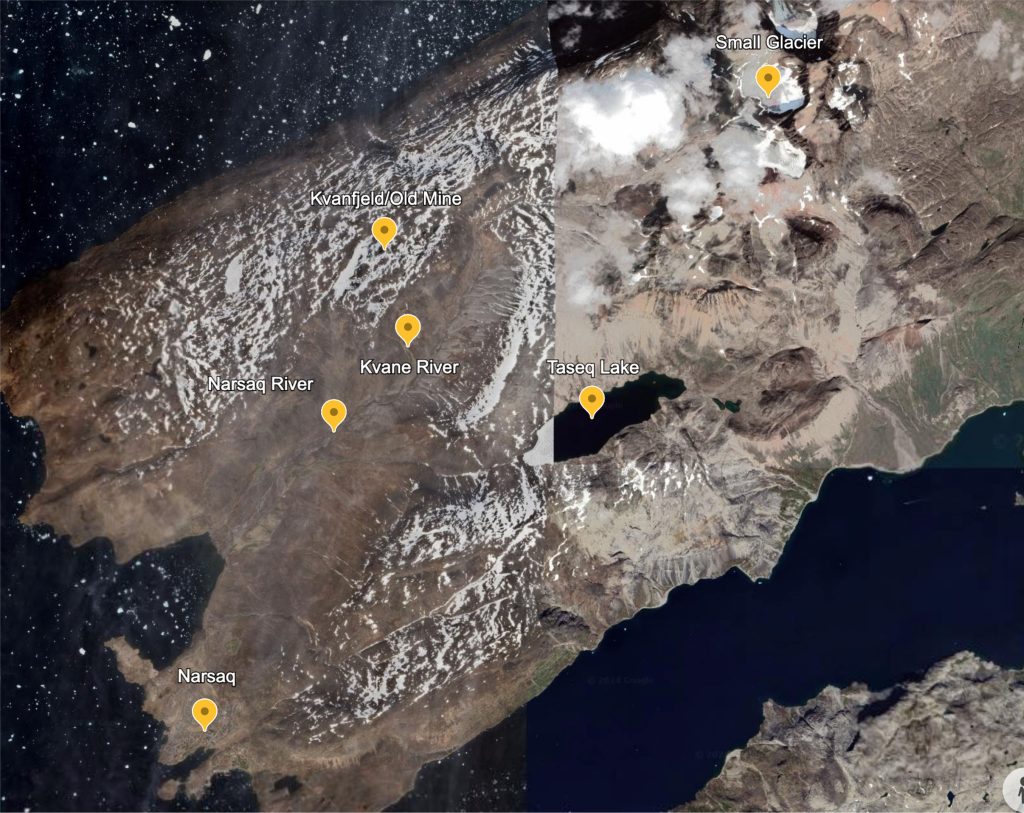
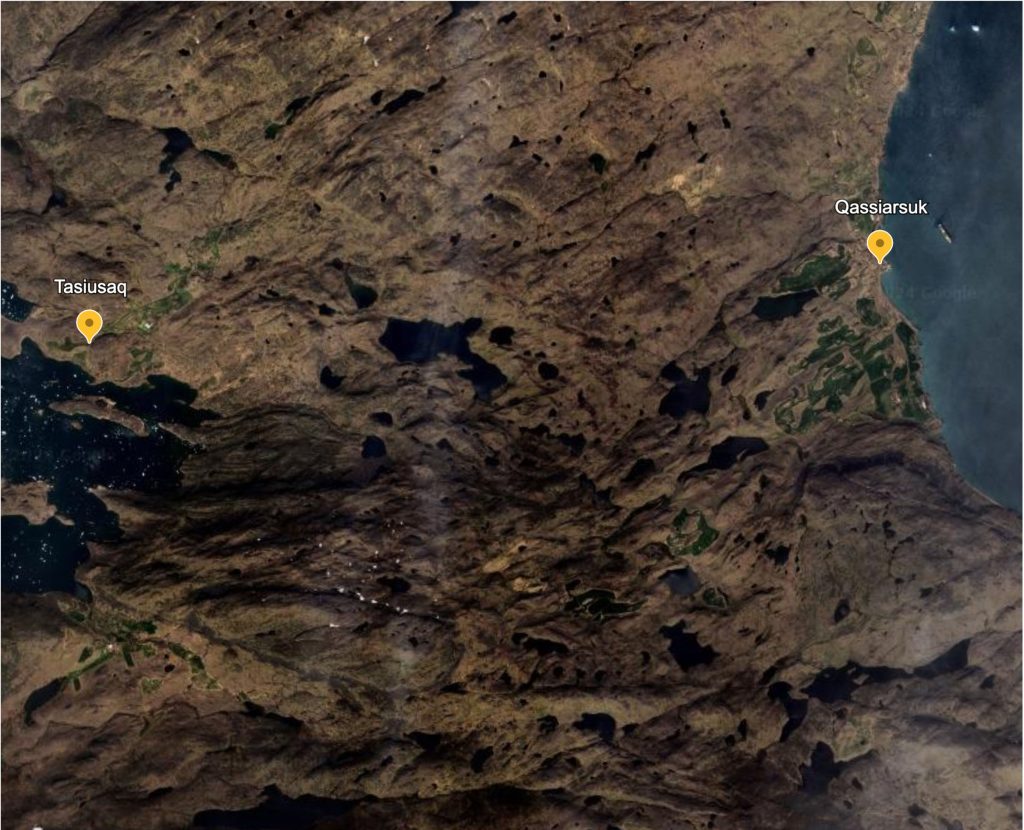
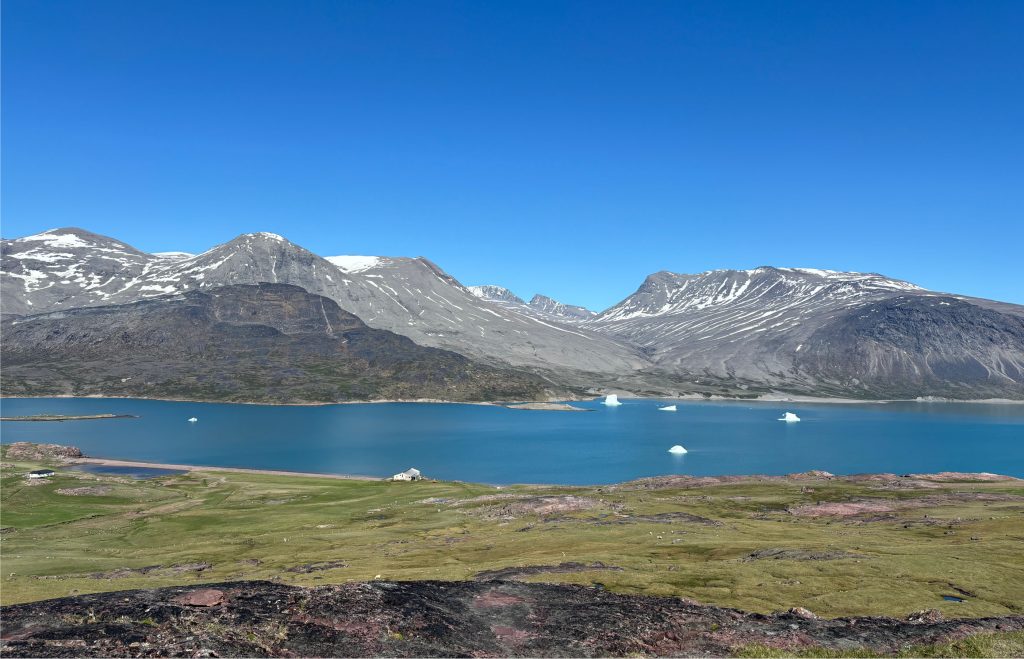
The settlements around which data was collected were Narsarsuaq, Igaliku, Narsaq, and Qassiarsuk, all located in the Kujalleq municipal region (Image 1). Each area is topographically dominated by the fjord landscape, including deep fjords and steep mountains. Narsarsuaq (Image 2) is a small settlement primarily serving as an airport and tourist hub for the surrounding fjord regions. This settlement’s primary study region was a river running through Flower Valley from the Kiattut Glacier. This river runs through several areas used for grazing sheep and passes by remnants of the old World War II base, Bluie West One. It is fed by snow meltwater and glacier meltwater. It runs into the Tunulliarfik Fjord. The settlement of Igaliku (Image 3) is located at the end of Igaliku Fjord and is a part of the UNESCO World Heritage-listed “Kujataa” area. It is a small sheep-herding settlement with around 30 full-time residents. We focused our sampling efforts on several freshwater lakes and rivers from mountains that drain into the fjord on the Igaliku side and at the end of Igaliku Fjord. Narsaq (Image 4) is the most populous area we visited, with between 1300 and 1400 people living there. Here, data collection focused on lakes in the mountains north of the town, the Narsaq River, and streams that flow into the river. Narsaq River originates from a small glacier at the top of Narsaq Valley. From the glacier, the river runs for about 10 km through the Narsaq Valley before discharging into the sea at Narsap Ilua. We sampled Taseq Lake, which connects to the Narsaq River through the Taseq River. In addition, we sampled several smaller lakes on the plateau between Kvanefjeld and Narsaq Fjeld that drain through the Kvane River into the Narsaq River. Finally, we sampled around Qassiarsuk (Image 5), another sheep farming settlement and part of the Kujataa area. Here, we focused on sampling streams and lakes between Qassiarsuk and Tasiusaq. This hilly area between two fjords contains many small lakes and a watershed that farmers use on either side for irrigation and drinking water. Sampling location images below.
B. Methods and Equipment
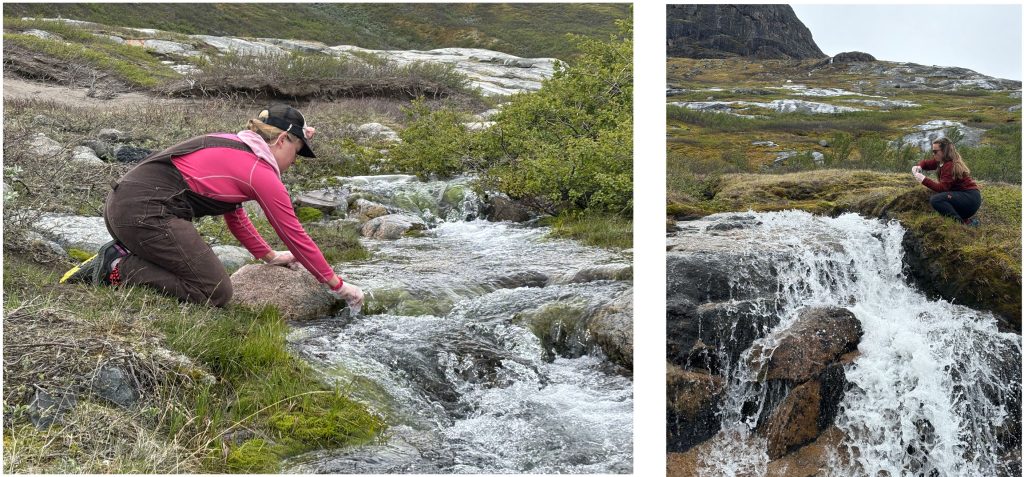
Samples were collected according to a precise protocol. We used polypropylene vials that were acid-cleaned before taking them to the field. In the field, the vials are handled with food-grade disposable gloves. The method for obtaining the water is to carefully unscrew the cap and fill it with water from an undisturbed sampling location. The vials are then stored in a cool, dark location for the remainder of the trip. If we need to scoop vials from a hard-to-reach location or off a boat, we attach the vials to the end of a PVC pole to extend our reach. For each location, two samples are taken. Each sample will be returned to the lab to be analyzed for different constituents to give a comprehensive range of water quality measurements. After the samples are taken, the precise coordinates are recorded from GPS, and notes are taken about the unique context of the sampling location. Later, the locations are mapped in Google Earth software, and information is logged in a spreadsheet.
Day to Day Activities
At each location mentioned above, we spent 3-4 days. On the days we moved from one location to the next, we took the remainder of the day to explore the settlement or town we were in. For every other day of the expedition, the primary activity was sampling water, and we followed a similar routine each day. The night before, we looked over detailed maps of the next day’s scheduled sampling locations. We discussed our objectives and any concerns or potential obstacles. We ate an early breakfast the following day and packed sampling, navigation, and safety equipment. While we had planned sampling locations for each day, while hiking, we also stayed aware of the landscape around us and any potential areas for sampling that had not been identified on the map because, during the melt season, there are many ephemeral drainages and because we did not always have access to precise maps of all watersheds in the area.
We met challenging and unexpectedly difficult-to-navigate terrain on a couple of our hikes. On one of these hikes, we were stopped from crossing a large, fast-flowing body of water. In this and other challenging situations, we worked as a team to decide if alternate routes would allow us to reach our desired sampling location or if we needed to change the goalpost of the day. Facing these obstacles was always an excellent opportunity to practice collaborative problem solving and provide us with adventure and excitement. In all but one case, we succeeded in getting to our desired sampling locations. In one situation in Narsaq, where the river was uncrossable, and the bridge we had expected to be able to use was no longer there as the map indicated, we had to come up with other places to sample while in the field. The day was still a success, and the team felt good about making a safe decision that allowed us to be productive.
Trip Highlights
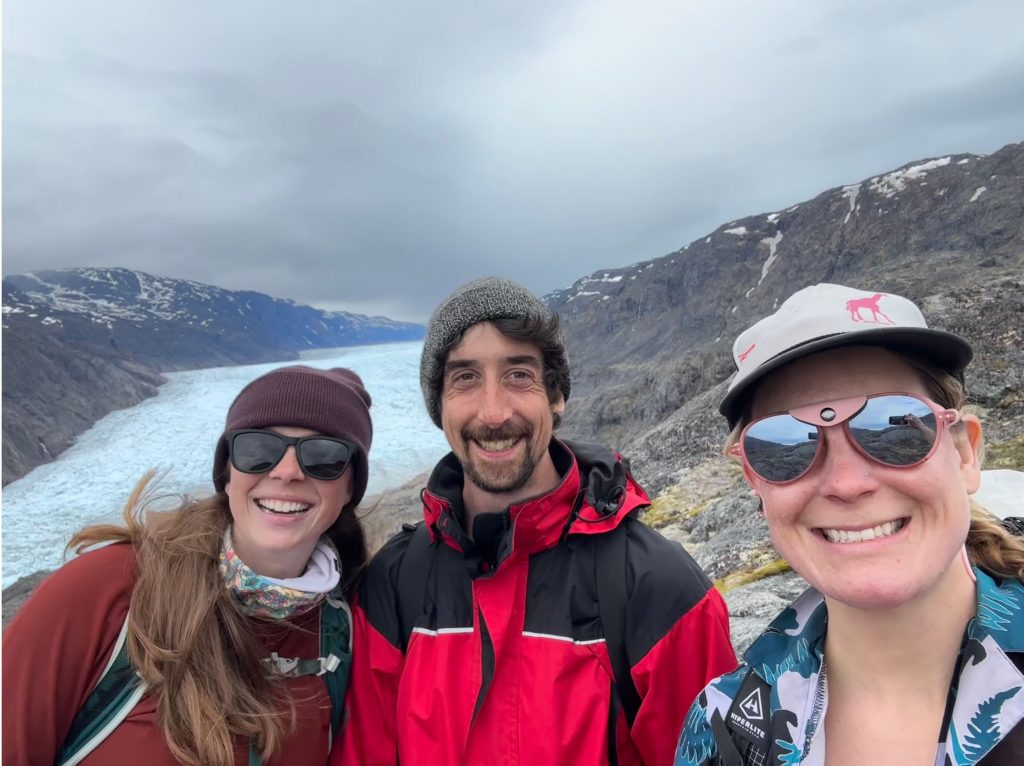
Some days of the trip provided exceptional experiences. On the team’s first full sampling day, we reached the top of a mountain pass that overlooked the Kiattut Glacier. This was the first time two team members had seen the Greenland Ice Sheet (GIS) in person. It is hard to describe the first look at the rising and vast expanse of ice and snow extending as far as the eye can see. It is one thing to read about and study this area and try to understand how the changes happening here will affect the rest of the world. It is quite another to be personally impacted by its vast size and the reality that it is rapidly receding and melting into the ocean. This experience provided a realistic grounding for many future conversations about change and how to respond to it at local, regional, and global scales.
In a very different way, another exceptional experience was our stay in the settlement at Igaliku. This small settlement nestled in a grassy valley surrounded by steep mountains rising directly out of the green-blue ocean filled us with a sense of peace and stillness. It felt, in a way, like every time we returned from a hike into the surrounding mountains, that any stress melted away as we felt our shoulders drop and our bodies start to relax. It felt like an area that has thus far been spared from the accelerating, runaway speed of 21st-century human civilization. However, while there, we witnessed a strong reminder that life’s realities are present even in such an idyllic location. On our last day in this location, the community was having a funeral ceremony for a man in the settlement who had died on the day that we first arrived. It was an excellent reminder that amid our goals and priorities in this place, lives are being lived, and we are present in these communities for a tiny fraction of time.
Conclusion
This field expedition was very successful. First, it gave us a third consecutive year of data collection from Flower Valley and Qassiarsuk. Second, we expanded the spatial distribution of data collection to a second location, the Kujaata UNESCO World Heritage Site. Third, we expanded our spatial sampling around the Narsaq area to the old Kvanefjeld mining site, and several lakes were planned to become part of the infrastructure of a potentially large rare earth metals mine. This spatial distribution further provides a baseline of water quality data for the region. It will allow for meaningful water quality data analysis over the coming years and decades as glaciers melt and human activities in the region shift.
Finally, I again extend thanks to Mrs. Elisabeth Crowley for her essential support of this expedition. Her dedication to environmental science and education has been instrumental in shaping my, and many others, journey and understanding of Greenland in a rapidly changing climate. This expedition advanced scientific knowledge and strengthened my commitment to environmental stewardship and interdisciplinary collaboration. As I reflect on my experiences in South Greenland, I am inspired to continue my efforts in safeguarding our planet’s fragile and vital ecosystems.