
UMaine Climate Change Institute’s Climate Reanalyzer connects centuries of climate data to illustrate the future
Figuring out how to use the wealth of climate and weather data gathered by various scientists and agencies around the world has become a herculean task. A tool developed at the University of Maine’s Climate Change Institute brings together a variety of these datasets into digestible charts, maps and animations that anyone can use — and indeed thousands do each day.
Using climate data ranging from the mid-1800s to today, and models projecting into this century, the UMaine Climate Change Institute’s Climate Reanalyzer makes climate change comprehensible through captivating visualizations of the past, present and future environment.
A centerpiece of this site is reanalysis, a type of climate datasets that estimate the state of the overall climate over past decades. Using the real-world observations from surface stations, weather balloons and satellites, this framework creates invaluable tools that researchers can use to understand climate variability and change.
The datasets that are accessible on Climate Reanalyzer come primarily from the National Oceanic and Atmospheric Administration (NOAA), as well as from the European Centre for Medium-Range Weather Forecasts (ECMWF) and other sources. This climate and weather data visualization website features many models and maps to explore. Each map represents different aspects of variables that affect the climate, including precipitation, temperature, wind and snow.
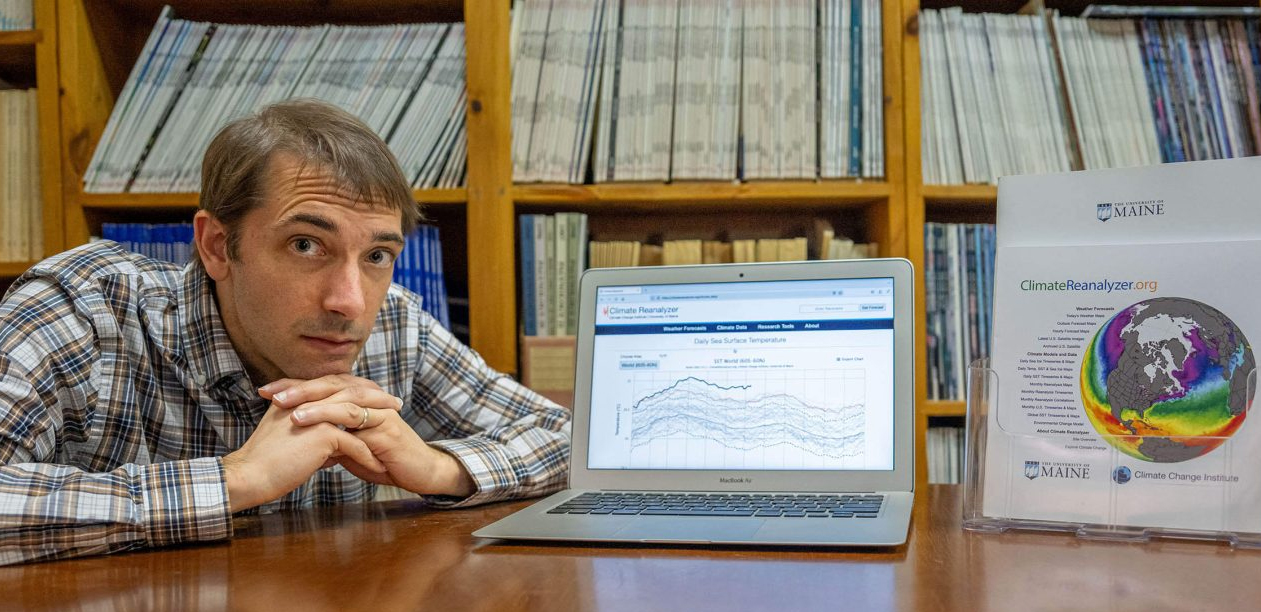
Sean Birkel, Maine state climatologist and assistant professor at the University of Maine with a joint appointment to the Climate Change Institute and Cooperative Extension, has been developing Climate Reanalyzer since 2012 and is constantly thinking of ways he can expand the site and improve its functionality. Climate Reanalyzer can be used for research or in the classroom, and also has pages such as “Today’s Weather Maps” that give a daily snapshot of weather along with some climate context. The site also includes weather forecast maps that update throughout the day and include a slider animation feature.
“You can learn so much about climate and weather by watching animations of different variables. You can see relationships between temperature, cloud cover, wind and moisture fields,” says Birkel.
Birkel ensures that variables the average viewer may not be familiar with are clearly defined on the site. At the bottom of the page entitled “today’s weather maps,” for example, is an explanation of “2M temperature,” a variable that represents air temperature two meters above the surface.
The idea for Climate Reanalyzer was seeded at a research meeting in Cambridge, England, in 2011 organized by Paul Mayewski, distinguished professor and director of the Climate Change Institute at UMaine. Mayewski asked Birkel, who was at the time a postdoctoral associate learning to run climate models, if he could develop a website for the Institute that could make visualizations for a then-new ECMWF reanalysis dataset.
Birkel says that while UMaine’s research collaborators in Cambridge had developed internal software for accessing the particular reanalysis product, there weren’t many tools available at the time where other researchers could easily access the data themselves.
Birkel was selected for this task due to his background in Linux and coding, which began with two programming courses in high school, a C++ course as an undergraduate, and MATLAB and FORTRAN experience gained while a graduate student at UMaine. He also had been building computers from parts and learning how to run different operating systems since middle school.
“That was invaluable – my experience with computers and programming from a young age,” Birkel says. “Climate Reanalyzer came up as a merger between my research interests and my ability to sit for hours and hours and write code.”
Soon after getting the basic website running, Birkel realized that he could not only add other reanalyses, but also detailed weather forecasts, which “would give people a reason to visit the site everyday, not just once a month.”
Birkel has written thousands of lines of code that allow for the maps on the site to automatically update when NOAA and ECMWF publish their latest datasets. In order to avoid overloading his computer systems, he staggers the times at which the maps update throughout the day.
“When I add a new variable or I add a new model, I have to make sure to schedule it carefully,” Birkel says.
There are multiple parts to the Climate Reanalyzer, requiring that it uses four servers to operate. Almost all of the data processing for the site is done using NCAR Command Language (NCL), which was recommended to Birkel by his postdoctoral mentor, Kirk Maasch, professor at the Climate Change Institute and School of Earth and Climate Sciences.
“NCL is absolutely wonderful for data analysis and producing high-quality 2D visualizations from these datasets,” says Birkel.
Birkel has received some help with writing codes for the Climate Reananlyzer from students over the years, including most recently the implementation of a 3D movable globe with image overlays.
As the Maine state climatologist and a member of the Maine Climate Council, there are many ways Birkel incorporates this technology into his climate services work, too. This trove of past data contains the vital information for creating accurate predictions of the future.
“This is very much integrated with both my role as state climatologist where I provide weather and climate information to Maine stakeholders, and my role as a researcher because I use Reanalyzer for analyzing datasets all the time,” Birkel says. “Many of the papers I have authored and co authored have used data accessed through the Climate Reanalyzer.”
The maps on the site not only aid research, but also help the public to understand and garner support for work in climate science. Now, with an average of 2,000 to 4,000 visitors to the site each day, the research tool is gaining national attention for its usefulness.
“There have been spikes, say if there was an extreme weather event, it can see several thousand [visitors] on certain days. I also see [Climate Reanalyzer graphics] on Twitter, and other social media posts, and I’m aware of a number of well known scientists who have referred to data and graphics from the site,” says Birkel. “Just in the last week, I was contacted by the Boston Globe, New York Times, Washington Post and Bloomberg about air and sea surface temperatures.”
In early July this year, a page on Climate Reanalyzer showing global data caught international attention as daily temperatures began to rise to record levels, triggering a surge of site traffic, including a day with nearly 80,000 visits.
UMaine’s community of researchers invested in climate studies is only part of what made it the ideal place to develop this project. The diversity of workers and researchers in Maine creates an opportunity to connect this technology with students, teachers, agricultural producers and other stakeholders and the state as a whole. As the site grows, Birkel would like to make more resources available to aid teachers of all grade levels in using the Climate Reanalyzer as part of lessons on climate and weather.
“I do want to emphasize the education component of the website,” Birkel says. “I am working with colleagues who are helping to develop site tutorials, and who are also interested in developing learning modules that would help teachers use Climate Reanalyzer in the classroom.”
Birkel also hopes to increase accessibility features on the website. His focus is primarily on ensuring the accessibility of maps for those with colorblindness and other visual impairments.
“A significant number of people have red-green color blindness. One of my colleagues is red-green colorblind and, sometimes, when I make a new colormap I’ll send over the image and ask if he can distinguish the colors.”
Birkel has also been reviewing accessibility resources, and has received helpful suggestions and critique from site users over the years, which have led to usability improvements.
Although the Climate Reanalyzer may appear intimidating at first, Birkel says the system truly can be used by anyone, whether a visitor is looking for updates on the big storm approaching or just viewing the daily forecast or a researcher extracting data from reanalysis.
“It’s like the old saying: a picture is worth a thousand words — but, if you have an animation of any pictures, it’s worth ten thousand words,” Birkel chuckles.
This story was written by Erin Cabral, 2023 Summer Intern at the UMaine Division of Marketing at Communications.