Concentrations at GISP 2 from 1750-1990

 |
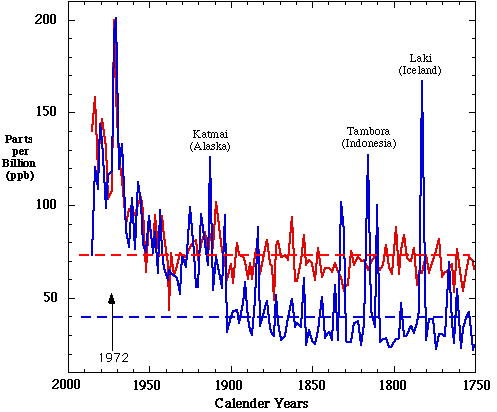
Sulfate (Blue Line) and Nitrate (Red Line) Concentrations at GISP 2 from 1750-1990 |  |

Concentrations of sulfate (blue line) and nitrate (red line) measured in the GISP2 Ice Core. Dashed lines represents the 2000 year average for each chemical measurement. Increase in sulfate starting just after 1900 is attributed to the increase in coal combustion during the Industrial Revolution. Increase in nitrate start later in the centrury and is attributed to increased burning of petroleum products. Most notable is the decrease in Sulfate concentrations since the early 1970's. This is attributed to the Clean Air Act established in the United States in 1972. Peaks in Sulfate are noted that correspond to volcanic eruptions.
(Data from Mayewski, et al., Nature, 1990 and Zielinski, et al., Science, 1994 )
| GISP2 Home Page GISP2 Programs and Principal Investigators GISP2 Notebooks Contribution Series GISP2 Data and Graphs More Information |